IA 첨삭 패키지
ToK 첨삭 패키지
커리큘럼
자주묻는질문
인재채용
Mentoring Program Curriculum (1)
/
Subjects
/
Economics
/
Topics
/
3. Macroeconomic
수학
영어
화학
생물
경제
전시회 Exhibition
에세이 Essay
일회성 첨삭
방학특강
정규반
Mentoring Program Curriculum (1)
/
Subjects
/
Economics
/
Topics
/
3. Macroeconomic
IA 첨삭 패키지
수학
영어
화학
생물
경제
ToK 첨삭 패키지
전시회 Exhibition
에세이 Essay
일회성 첨삭
커리큘럼
방학특강
정규반
자주묻는질문
인재채용
3. Macroeconomic
Tags
Gallery view
Search
How to measure economic activity
Gross Domestic Product (GDP)
: the value of all final goods and services produced within an economy over a period of time, usually a year or a quarter.
•
Gross National Income (GNI):
G
D
P
+
factor income from abroad
−
factor income sent abroad.
G D P+\text { factor income from abroad }- \text { factor income sent abroad. }
G
D
P
+
factor income from abroad
−
factor income sent abroad.
•
GDP or GNI per capita:
GDP or GNI
population of the country
\frac{\text { GDP or GNI }}{\text { population of the country }}
population of the country
GDP or GNI
•
Real GDP or GNI per capita at purchasing power parity (PPP):
converts each country’s per capita income figure to a common currency.
3.1. Measuring economic activity and illustrating its variations
Aggregate demand
Aggregate demand(AD):
total spending on domestic goods and services at average price levels per period of time.
•
AD = C + I + G + (X-M)
Why is the AD curve downward sloping?
Shifts of the AD curve
3.2 Variations in economic activity: aggregate demand and aggregate supply
Economic growth
Economic growth:
increase of real GDP over time.
Growth
2
2019
→
2020
=
r
G
D
P
20
−
r
G
D
P
19
r
C
D
P
19
×
100
\text { Growth } 2_{2019 \rightarrow 2020}=\frac{r G D P_{20}-r G D P_{19}}{r C D P_{19}} \times 100
Growth
2
2019
→
2020
=
r
C
D
P
19
r
G
D
P
20
−
r
G
D
P
19
×
100
•
Growth rate = % change of real GDP between two periods.
Assume that real GDP in 2019 = $19,220 billion & real GDP in 2018 = $18,783 billion.
Growth in
2019
=
19220
−
18783
18783
×
100
=
2.33
%
\text { Growth in } 2019=\frac{19220-18783}{18783} \times 100=2.33 \%
Growth in
2019
=
18783
19220
−
18783
×
100
=
2.33%
Growth over the short term
3.3 Macroeconomic objectives
Measuring economic inequality
Economic inequality:
unequal distribution of income and wealth.
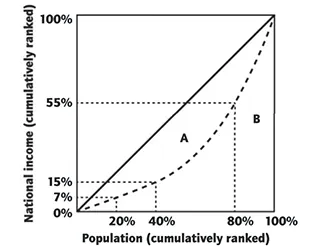
Figure 3.4.1 Lorenz curve
•
The poorest 20% of people receives only 7% of national income.
•
Diagonal line: line of perfect income equality (i.e. poorest 20% earns 20% of income and the poorest 40% earns 40% of income).
•
As we move further to the right of the diagonal, the distribution of income becomes more and more unequal.
Gini coefficient:
ratio of the area between the Lorenz curve and the diagonal over the area of the half-square.
3.4 Economics of inequality and poverty
Functions of money
•
Medium of exchange
•
Unit of account
•
Store of value
•
Standard of deferred payment
3.5 Demand management (demand-side policies): monetary policy
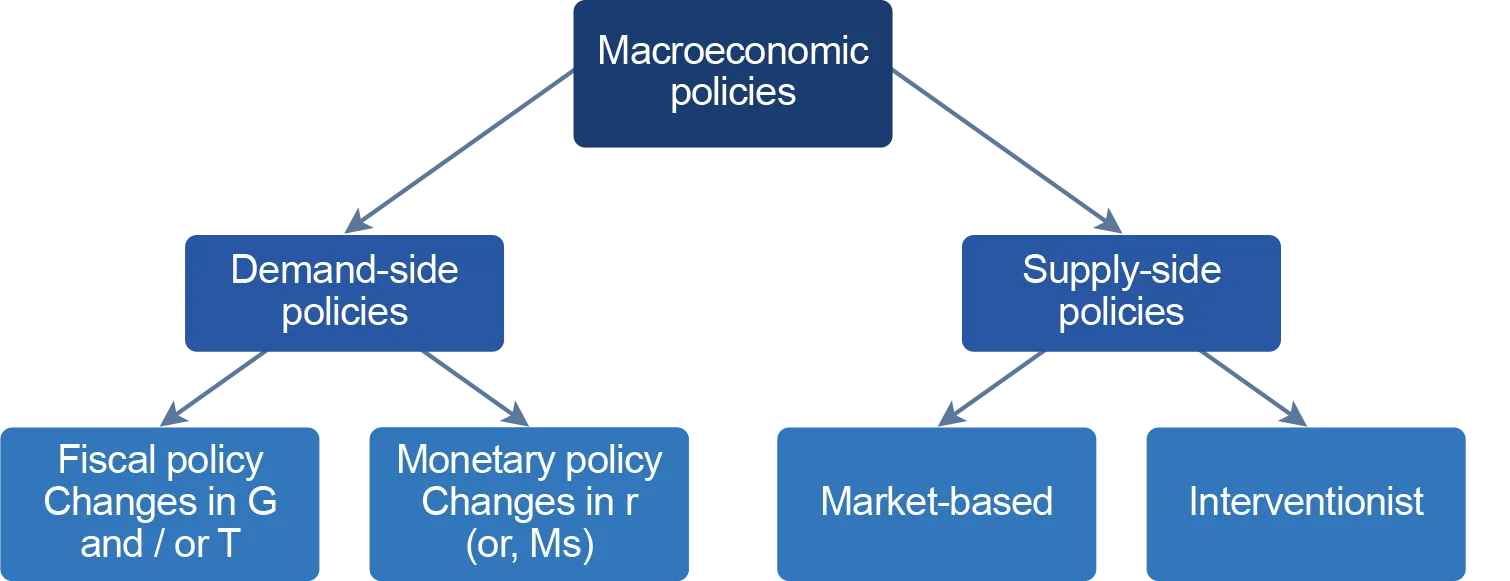
Fiscal policy:
changes in the level of government expenditures (G) and taxes (T) to affect AD.
Government expenditures
Government revenues
Where government gets its revenue from:
•
Direct tax.
•
Indirect tax.
3.6 Demand management (demand-side policies): fiscal policy Fiscal policy
Supply-side policies:
attempt to shift LRAS to the right and achieve long-run economic growth.
Goals of supply-side policies
Market-based policies
Product market related policies
Labour market related policies
3.7 Supply-side policies
Economic growth
Fiscal policy
Monetary policy
Supply-side policy
3.8 Macroeconomic policies - strengths, limitations and conflicts